The U.S. dollar surged and equities stumbled following the release of the U.S. employment cost index, which revealed a robust 1.2% increase, the sharpest uptick in a year. This data underscores the tightness of the U.S. job market and raises concerns about potential inflationary pressures. Investors are eagerly anticipating the Federal Open Market Committee (FOMC) meeting minutes scheduled for later today, with expectations tilted towards a hawkish tone amid the backdrop of a resilient U.S. economy.
Gold prices plummeted to a one-month low as the dollar strengthened, fueled by geopolitical easing in the Middle East, thereby diminishing demand for the traditional safe-haven asset. Concurrently, oil prices faced downward pressure, influenced by a notable uptick in U.S. crude stockpiles, prompting apprehensions regarding oil demand in the nation.
Meanwhile, newly launched Bitcoin (BTC) and Ethereum (ETH) Exchange-Traded Funds (ETFs) in Hong Kong failed to garner significant investor interest, with first-day trading volumes briefly surpassing $10 million. This lackluster reception underscores tepid market sentiment towards crypto assets, particularly as BTC prices dipped below the $60,000 mark in the prior session, awaiting insights from the impending Fed monetary meeting minutes.
Current rate hike bets on 1st May Fed interest rate decision:
Source: CME Fedwatch Tool
0 bps (97%) VS -25 bps (3%)
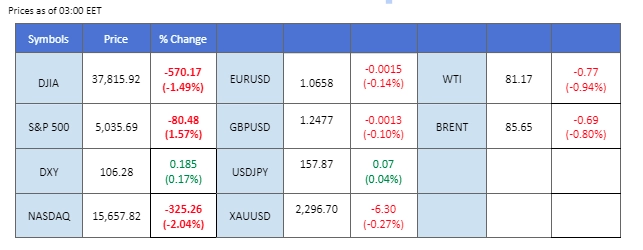
Market Overview
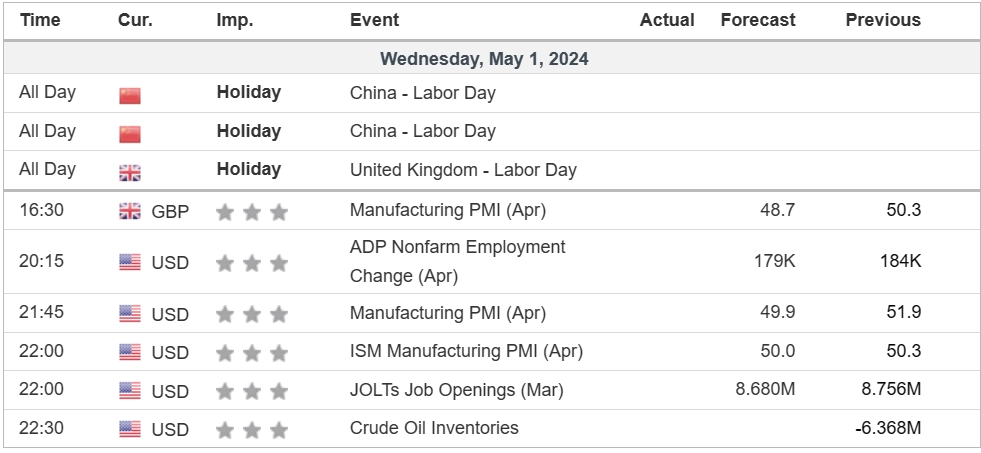
Economic Calendar
(MT4 System Time)
Source: MQL5
Market Movements
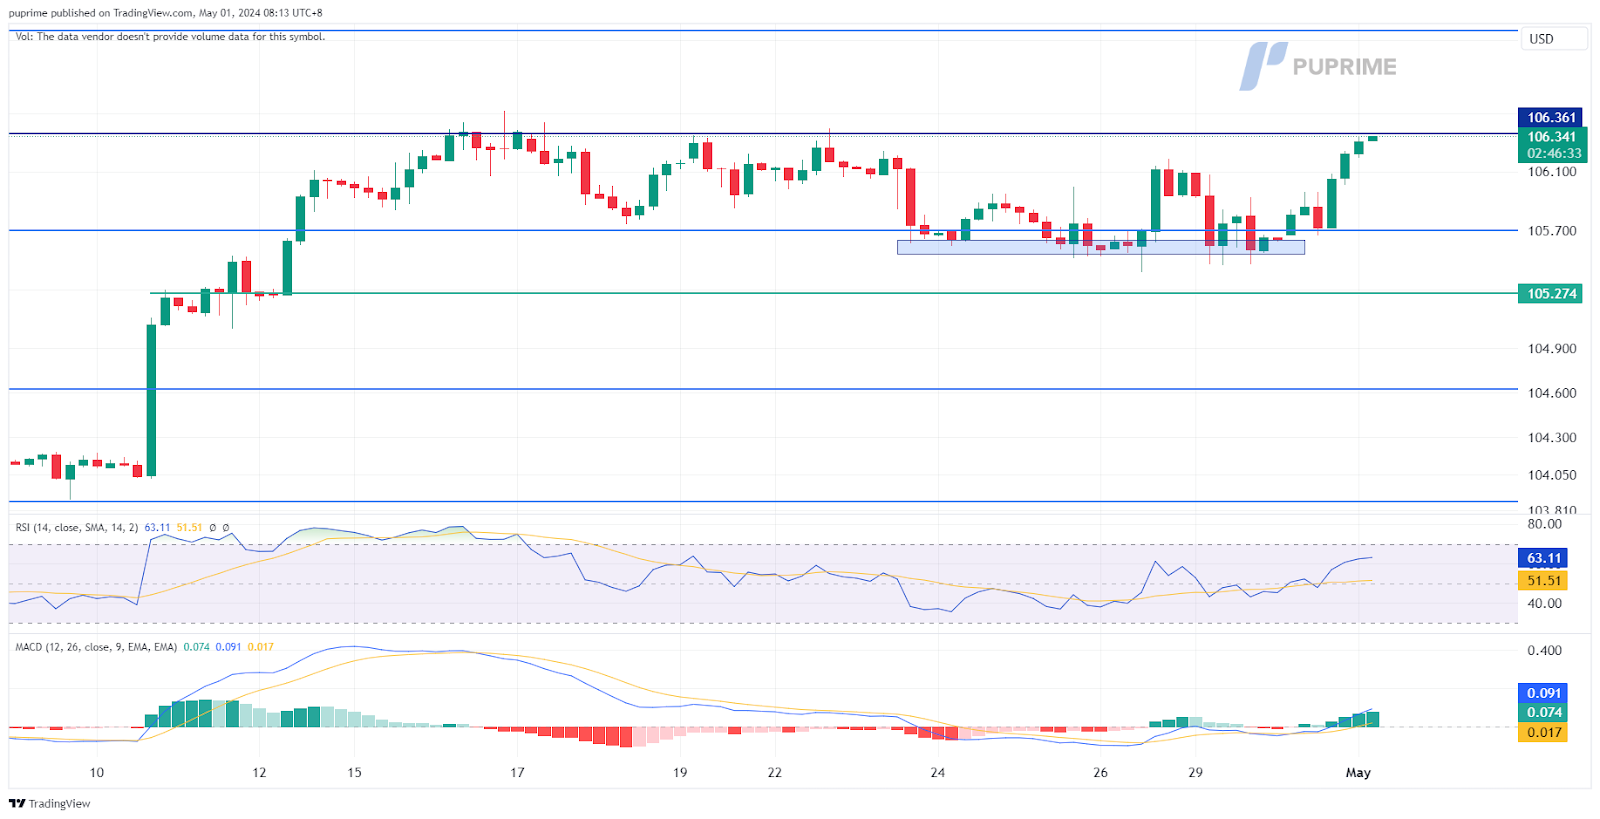
DOLLAR_INDX, H4
The Dollar Index (DXY) found significant support at the crucial liquidity zone near the 105.50 level, with a notable rebound from these lows indicating a bullish signal for the index. This rebound was propelled by the latest U.S. employment cost index, which reported a substantial increase of 1.2%. This uptick in employment costs is indicative of potential rising inflationary pressures within the U.S. economy. As a result, the anticipation of a more assertive approach from the Fed to control inflation has bolstered the strength of the U.S. dollar.
The Dollar Index has climbed sharply and is currently approaching its strong resistance level at 106.35 level, a break above at such level may be a strong bullish signal for the index. The RSI is approaching the overbought zone while the MACD has broken above the zero line suggesting a fresh bullish momentum is forming.
Resistance level: 107.00, 107.85
Support level: 105.70, 105.20
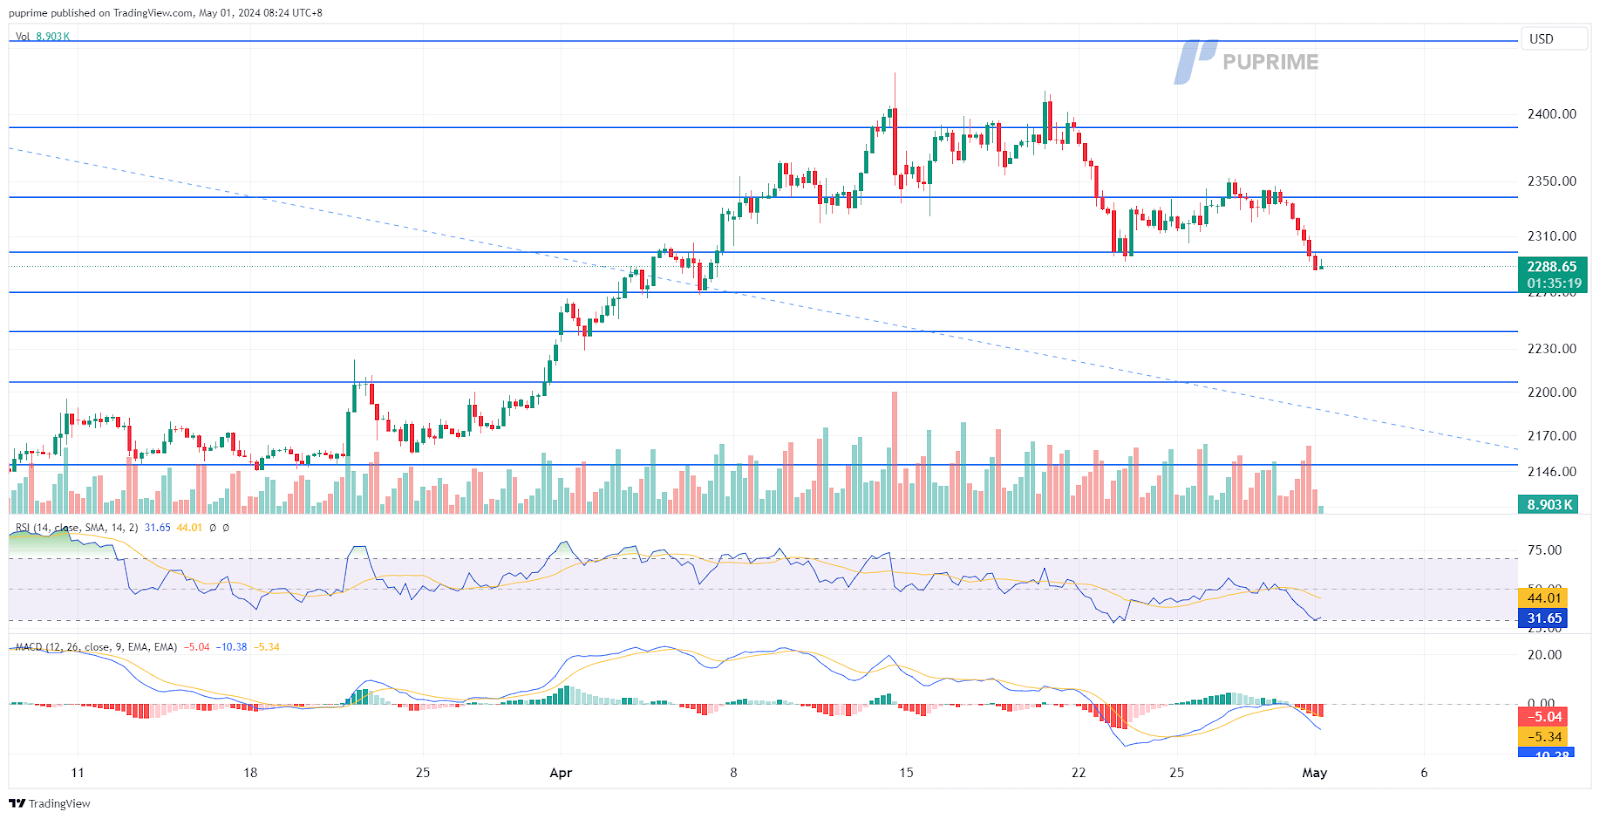
XAU/USD, H4
Gold prices are nearing their lowest levels in a month, signalling a bearish trend for the precious metal. The decline in gold prices has been primarily driven by a strengthening U.S. dollar, which has benefited from a series of upbeat economic data releases from the United States. A stronger dollar typically weighs on gold, as it makes the metal more expensive for holders of other currencies, thus reducing demand. Additionally, a reduction in geopolitical tensions in the Middle East has also dampened the appeal of gold as a safe haven.
Gold prices, currently traded to the lowest levels in nearly a month, suggest a bearish signal for the gold. The RSI is on the brink of breaking into the oversold zone, while the MACD failed to break above the zero line, suggesting the bearish momentum is overwhelming.
Resistance level: 2338.70, 2390.00
Support level: 2270.00, 2241.00
GBP/USD,H4
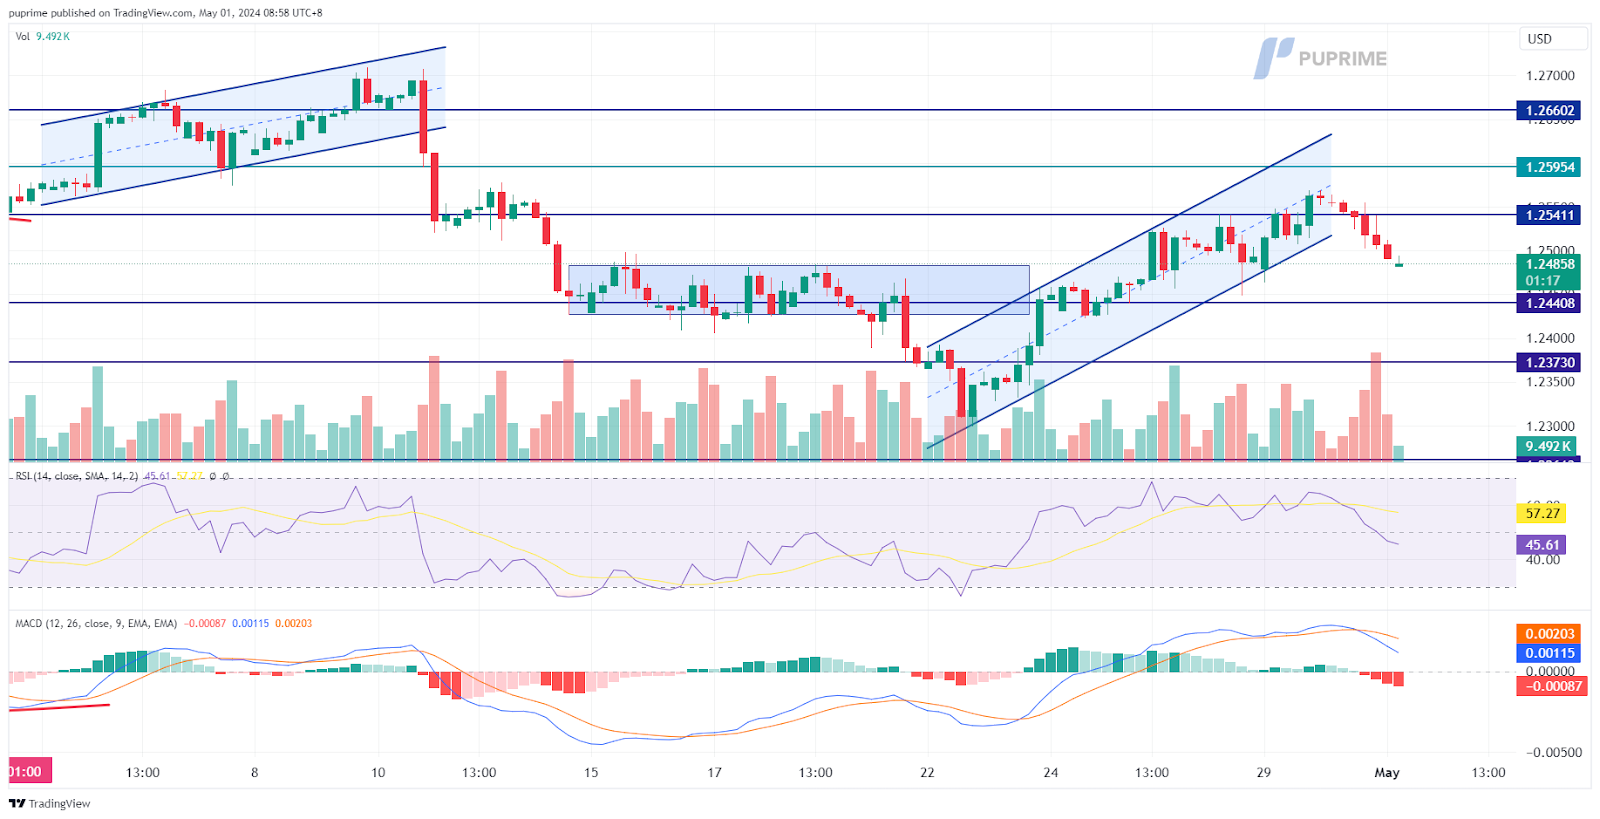
The GBP/USD pair has shown a shift in momentum, moving out of its recent uptrend channel and taking a downward turn as the dollar gained strength during the last trading session. This movement primarily reflects the dominant influence of the U.S. dollar in the pair’s dynamics, given that there has been a lack of significant fundamental drivers from the U.K. side to steer the currency’s direction independently. For traders and investors, the release of the minutes from the Federal Open Market Committee (FOMC) meeting later today is crucial as to gauge the direction of the pair.
The GBP/USD has fallen out of the uptrend channel, suggesting a potential trend reversal for the pair. The RSI eases from near the overbought zone while the MACD has crossed on the above, suggesting the bullish momentum has vanished.
Resistance level: 1.2540, 1.2660
Support level: 1.2440, 1.2370
EUR/USD,H4
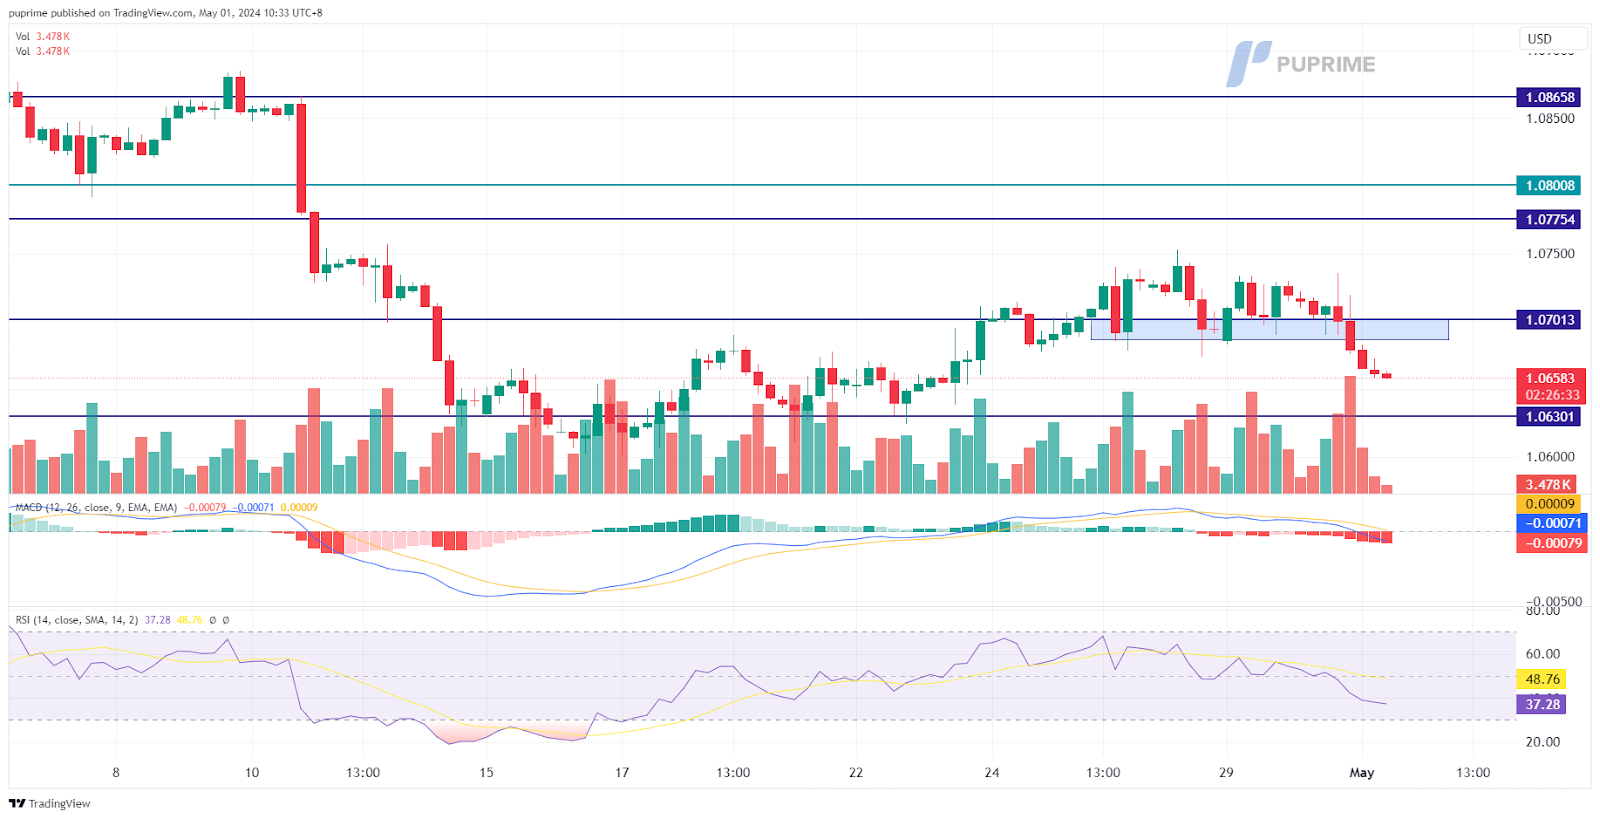
The EUR/USD pair’s recent break below its short-term liquidity zone indicates a potential bearish trend reversal, signalling a shift in market sentiment towards the euro. This movement aligns with the latest Consumer Price Index (CPI) data from the Eurozone, which reported an inflation rate of 2.4%. This figure is relatively close to the European Central Bank’s (ECB) target rate of 2%, leading to speculation among traders and investors about the possibility of an earlier-than-expected rate cut by the ECB.
The pair has declined to below its previous low level from its recent peak, suggesting a bearish trend reversal. The MACD is on the brink of breaking below the zero line, while the RSI is approaching the oversold zone, suggesting bearish momentum is forming.
Resistance level: 1.0700, 1.0775
Support level: 1.0630, 1.0560
Nasdaq,H4
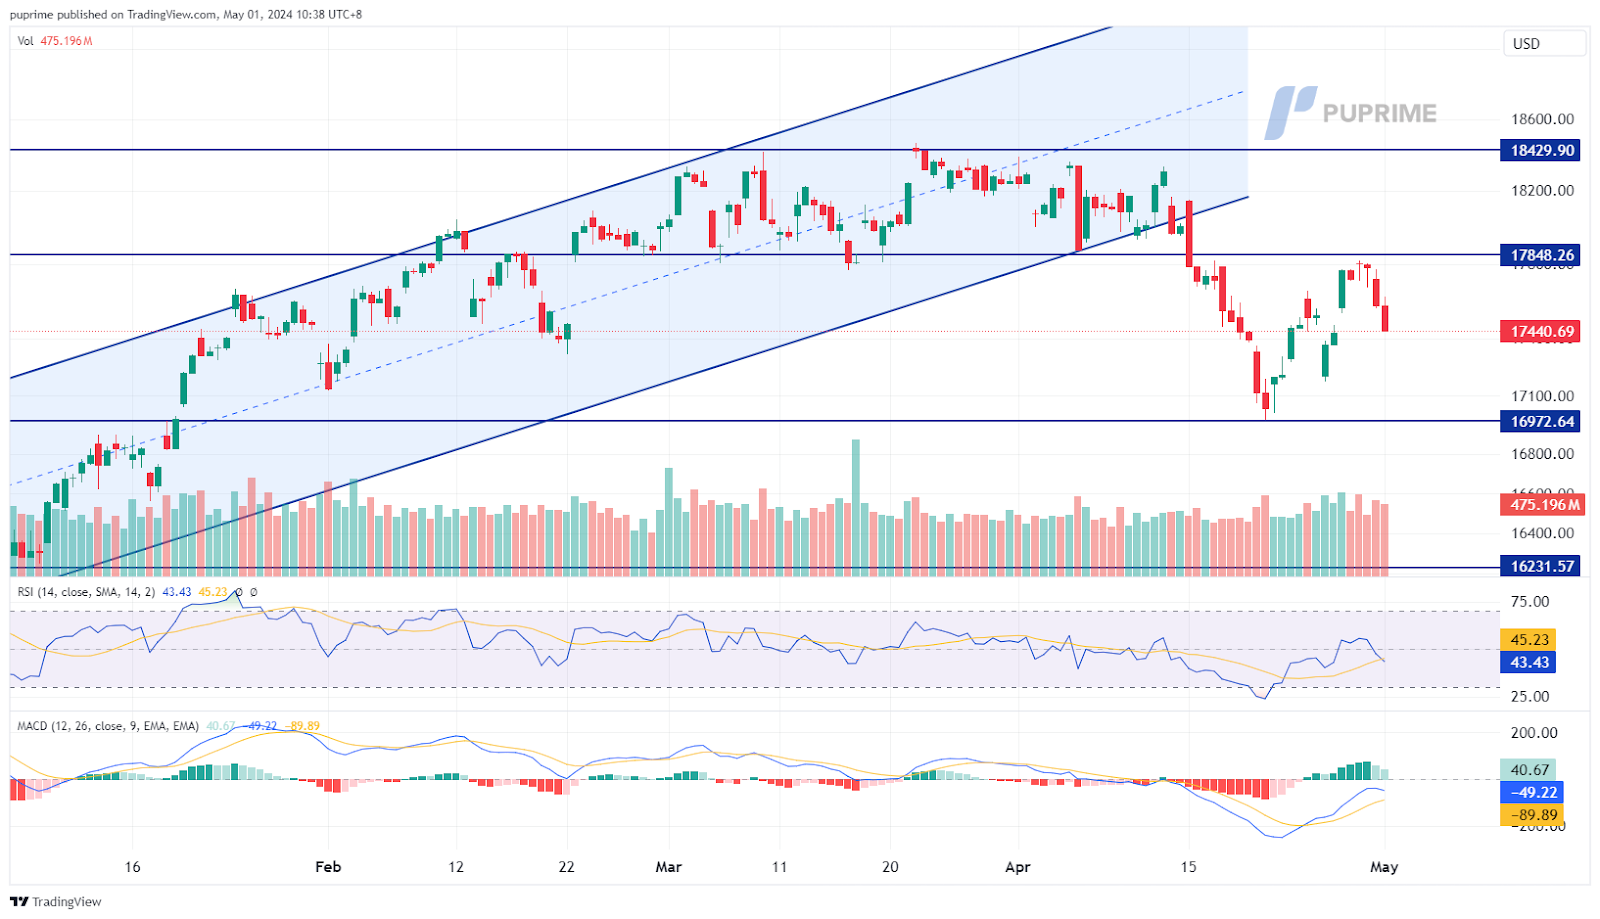
The U.S. equity market, particularly the NASDAQ, experienced significant pressure in the last session, primarily driven by the latest U.S. employment cost index data. This index indicated a continued tightness in the job market with robust wage growth. This kind of data can signal persistent inflationary pressures because as wages increase, potentially driving prices higher across the economy. Given these dynamics, investors are increasingly concerned that the Federal Reserve might adopt a more hawkish stance on monetary policy. A hawkish Fed tends to be a negative factor for stock markets including the Nasdaq.
Nasdaq has seesawed over the past few sessions but has yet to drop below its previous high, suggesting the index remains trading with bullish momentum. The RSI halted at near the 50 level, while the MACD is attempting to break through the zero line from below, suggesting the bullish momentum remains.
Resistance level: 17850.00, 18430.00
Support level: 16975.00, 16230.00
USD/JPY, H4
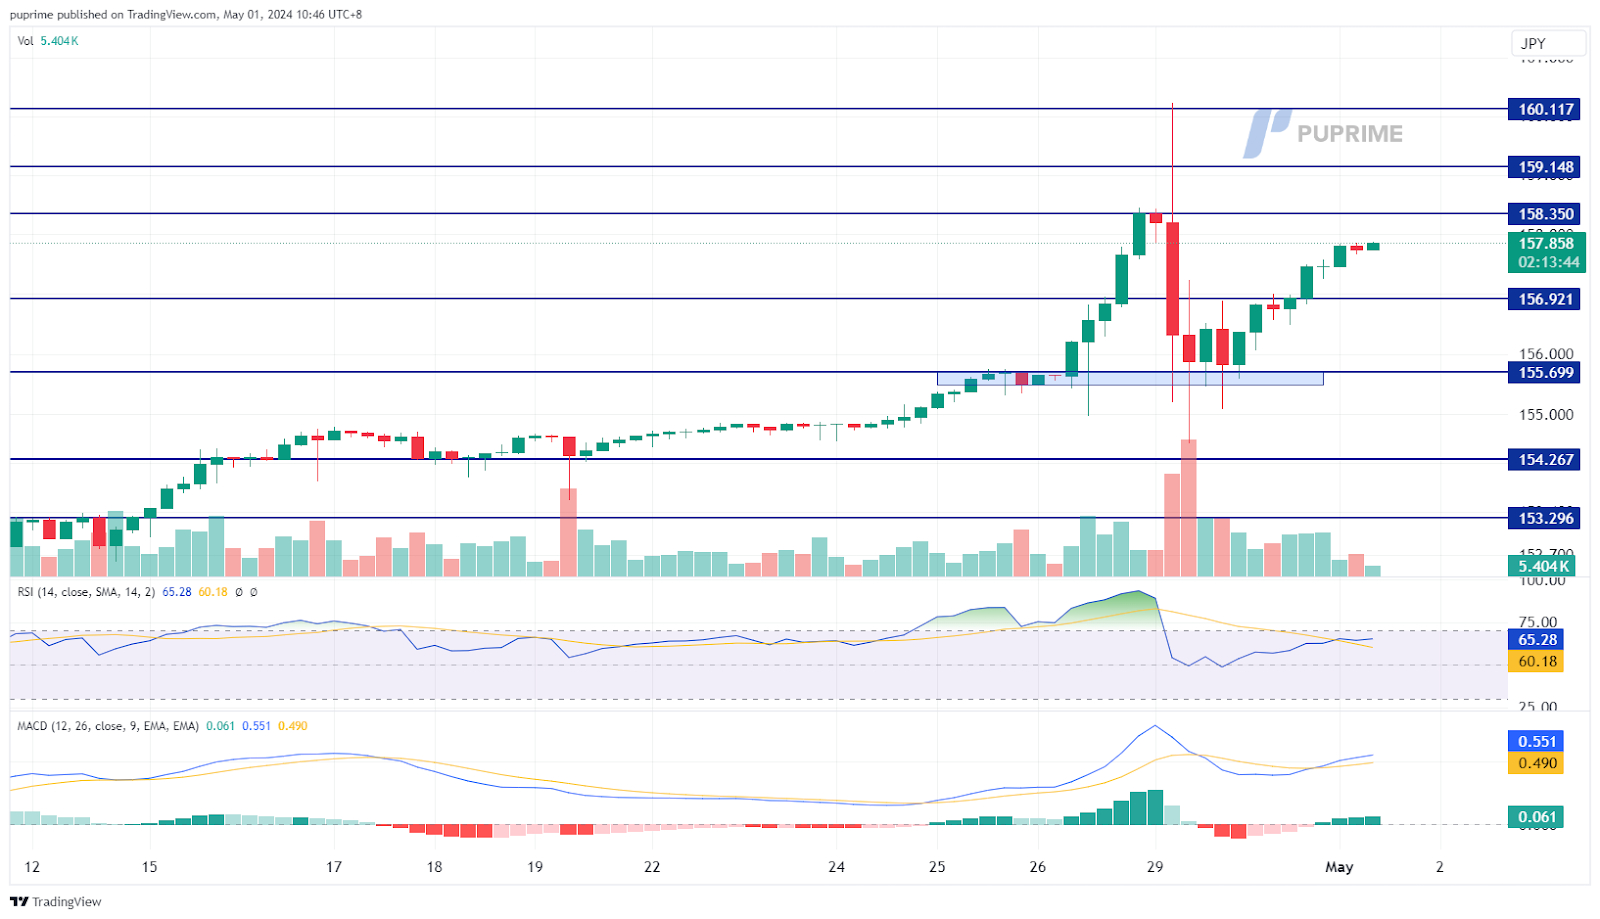
The USD/JPY pair has experienced significant volatility, with a sharp recovery after the Yen appreciated abruptly due to speculations of an intervention by the Bank of Japan (BoJ). These speculations were fueled by a discrepancy in the BoJ’s current account figures, where there was a shortfall of ¥5.5 trillion compared to market projections. This has led market participants to believe that the sudden appreciation of the Yen on Monday was the result of covert intervention by Japanese authorities. The Yen’s sharp appreciation suggests that traders and investors believe the BoJ views the 160 level against the dollar as a critical threshold for intervention.
The pair rebounded from its crucial liquidity zone at near 155.50 level, suggesting the bullish trajectory remains. The RSI is climbing back to the overbought zone while the MACD remains elevated, suggesting the bullish momentum remains strong.
Resistance level: 158.35, 159.15
Support level:156.90, 155.70
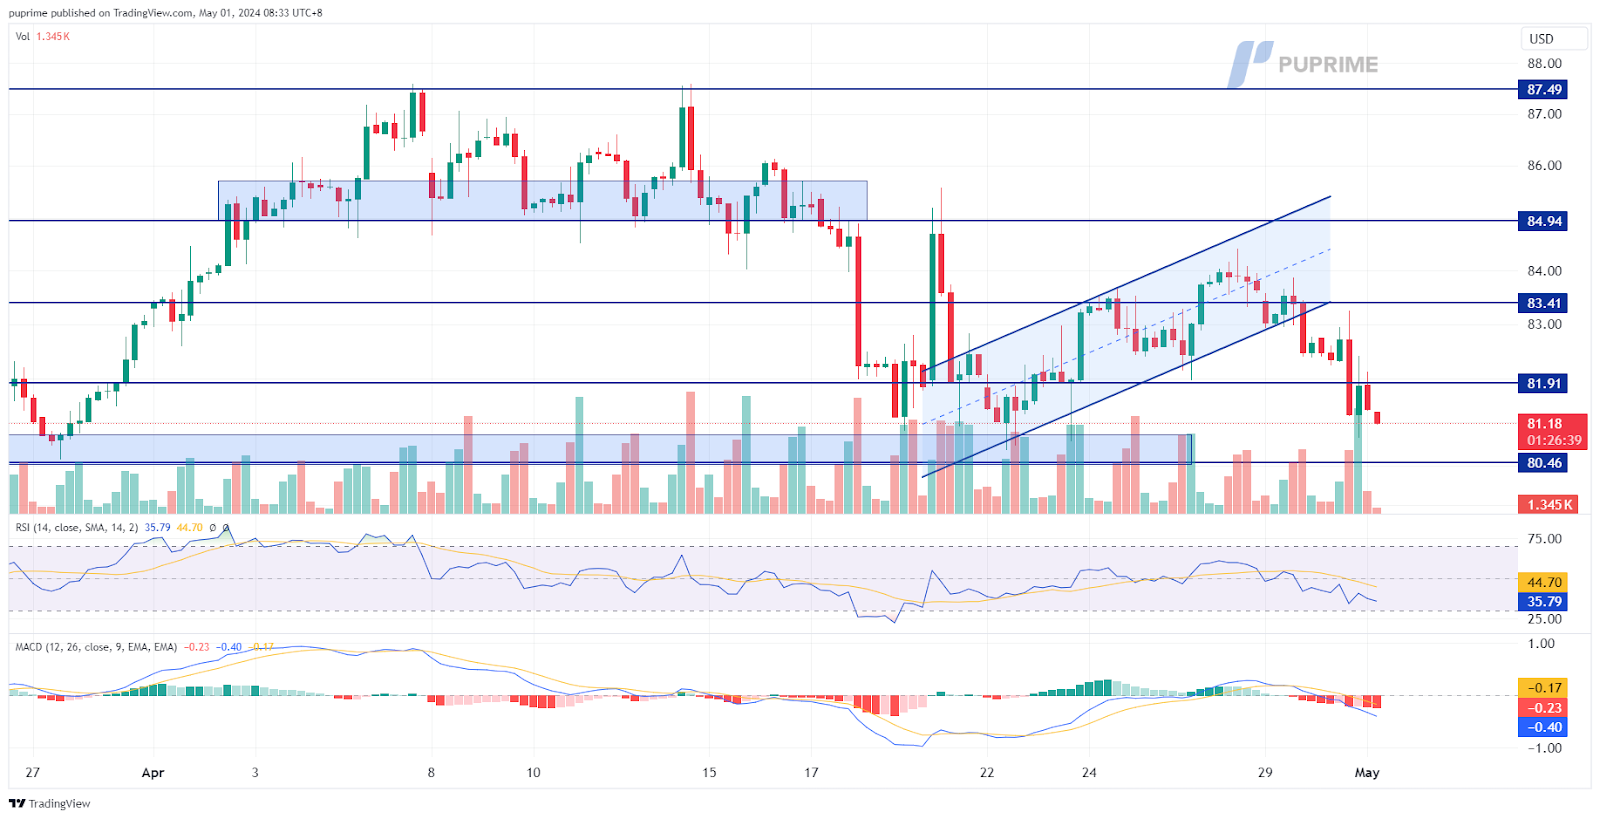
CL OIL, H4
Oil prices have broken out from their recent uptrend channel, signalling a potential trend reversal and indicating a shift towards a bearish trajectory. The decline in oil prices can be attributed to several factors, including a significant build-up in U.S. crude stockpiles, which has raised concerns about oversupply in the market. Additionally, the easing of geopolitical tensions in the Middle East has contributed to the downward pressure on oil prices.
Oil prices are trading back to their crucial liquidity zone, which serves as a strong support level. The RSI is gradually declining toward the oversold zone, while the MACD has broken below the zero line, suggesting that bearish momentum is forming.
Resistance level:81.90, 83.40
Support level: 80.45, 78.00
Bắt đầu Giao dịch với lợi thế
Giao dịch ngoại hối, chỉ số, Kim loại,...với phí chênh lệch thấp trong ngành và khớp lệnh nhanh như chớp
Bắt đầu giao dịch với số tiền nạp thấp nhất là $50 cho tài khoản Standard của chúng tôi.
Hỗ trợ 24/7.
Truy cập hàng trăm công cụ, công cụ giáo dục miễn phí và một số chương trình khuyến mãi tốt nhất xung quanh.
Please note the Website is intended for individuals residing in jurisdictions where accessing the Website is permitted by law.
Please note that PU Prime and its affiliated entities are neither established nor operating in your home jurisdiction.
By clicking the "Acknowledge" button, you confirm that you are entering this website solely based on your initiative and not as a result of any specific marketing outreach. You wish to obtain information from this website which is provided on reverse solicitation in accordance with the laws of your home jurisdiction.
Ten en cuenta que el sitio web está destinado a personas que residen en jurisdicciones donde el acceso al sitio web está permitido por la ley.
Ten en cuenta que PU Prime y sus entidades afiliadas no están establecidas ni operan en tu jurisdicción de origen.
Al hacer clic en el botón "Aceptar", confirmas que estás ingresando a este sitio web por tu propia iniciativa y no como resultado de ningún esfuerzo de marketing específico. Deseas obtener información de este sitio web que se proporciona mediante solicitud inversa de acuerdo con las leyes de tu jurisdicción de origen.